Science
Scientific results
The described CrescNet process has produced very significant results. It was and is made possible by the financial commitment of numerous sponsors, who are expressly thanked for their support. Discussions on this can be found in a large number of publications.
Disease-specific Cohorts
Within CrescNet, there are disease-specific cohorts that focus on specific clinical conditions. Special modules have been developed for these cohorts, enabling highly specific and detailed documentation of the respective disease. This allows us to ensure that the data collected meets the specific requirements and needs of those affected.
To ensure the quality and relevance of the data, advisory boards have been set up for selected cohorts. These are composed of renowned experts in the respective field and provide technical and strategic support for the work of the registry. Among other things, the advisory board decides on submitted project agreements, thus ensuring the targeted use of the registry data.
The work of the registry and the individual cohorts is based on clear statutes that ensure transparency and traceability. These statutes are publicly available and offer interested parties the opportunity to find out about the objectives, structures, and processes.
| Cohort | Description |
|---|---|
| Achondroplasia |
Dedicated to the systematic collection and evaluation of data on achondroplasia, a genetic growth disorder. The aim is to support understanding of the development of affected children and adolescents and to improve their quality of life in the long term. Click to show advisory board members
|
Early detection
Through CrescNet, the detection of growth and developmental disorders is improved. On average, the patients with proven growth hormone deficiency identified by the screening program at the Treatment Centre at the Clinic for Children and Adolescents at Leipzig University Hospital were able to receive the necessary substitution at least two years earlier. ( see list of publications: Die Früherkennung von Wachstumsstörungen - System CrescNet im Behandlungszentrum Leipzig im Deutschen Ärzteblatt)
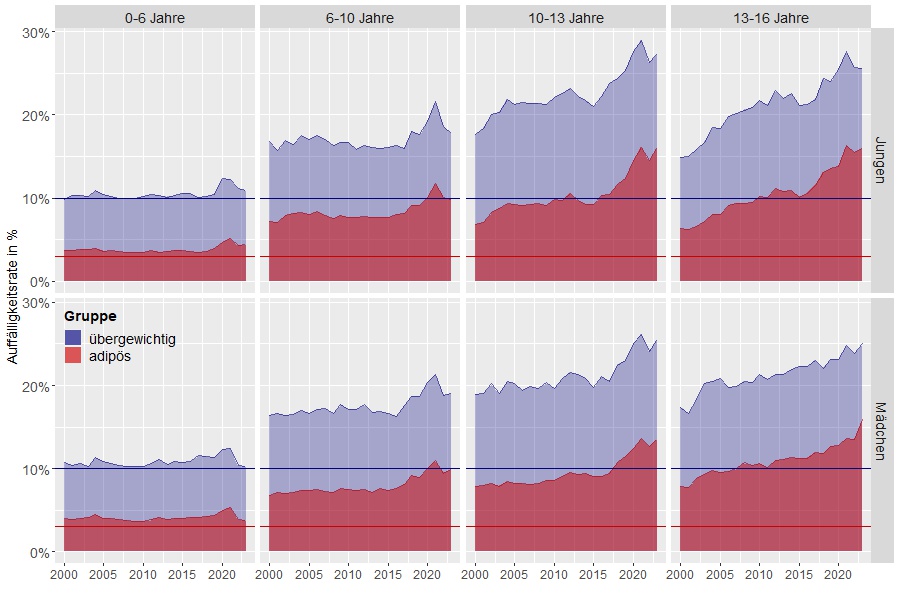
Monitor for conspicuity rates overweight and obesity
Since CrescNet continuously collects data from practices and clinics, it is possible to determine overweight and obesity rates based on age. This is assessed by the Body Mass Index (BMI). A BMI value between the 90th and 97th percentile is considered overweight. If the BMI value in childhood is above the 97th percentile, it is called obesity. You can look at graphs here that record the development of prevalence rates for overweight and obesity since 1999.
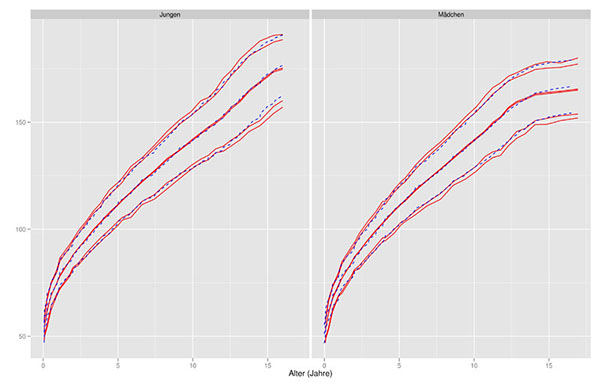
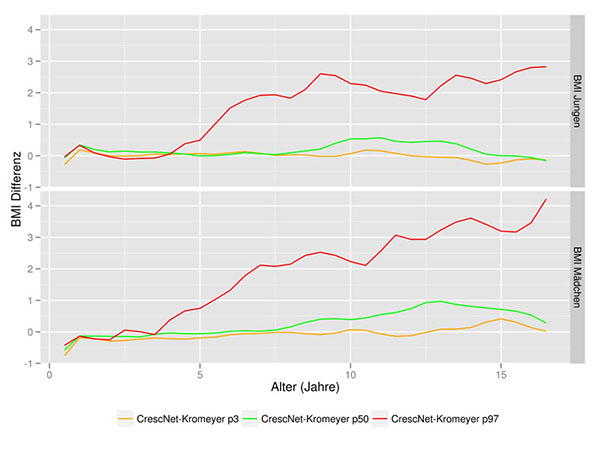
Reference curves and secular trendDescribed at annual (or shorter if necessary) intervals are the growth and weight trends of the entire child and adolescent population covered. The measured values of body size show only marginal differences. to recognised German reference curves according to Kromeyer-Hauschild et al. (2001). The red double lines show the confidence interval for the 3rd, 50th and 97th percentiles from CrescNet data. The blue dashed line denotes the Kromeyer-Hauschild reference percentiles. This picture corresponds to the general observation that body sizes in Central Europe have hardly changed for about 30 years. However, the development of weight is very different from this. The relationship between height and weight is expressed by the body mass index (BMI) and assessed by percentiles. The differences in BMI percentiles P3 and P50 to reference data of Kromeyer-Hauschild et al. (2001) are marginal. However, there is an increasing upward deviation towards the 97th percentile (P97) from the fourth year of life onwards. |
▶ Open Reference Data Collection
|
Publications of CrescNet
-
2025: Limb lengthening in individuals with achondroplasia: Analysis of an international survey
Beger C, Alves I, Carl-Innig P, Sessa M, Mohnike K, Cheung MS
Bone 2025:117462. -
2025: Severity of Congenital Heart Defects Affects Long-Term Somatic Development
Kiess A, Bimboese P, Gausche R, Beger C, Meigen C, Vogel M, et al.
Pediatric Cardiology 2025. -
2023: High but decreasing prevalence of overweight in preschool children: encouragement for further action
Maessen SE, Nichols M, Cutfield W, Norris SA, Beger C, Ong KK
BMJ. 2023 Oct 9;383:e075736. -
2022: Growth Patterns of Children With Short Stature in Adulthood According to Auxological Status and Maturity at Birth
Pfäffle R, Knüpfer M, Göbert M, Vogel M, Gausche R, Beger C, Keller E, Körner A, Thome U, Kiess W
J Clin Endocrinol Metab. 2022 Nov 25;107(12):3320-3327. doi: 10.1210/clinem/dgac510. -
2022: The influence of body mass index on the growth hormone peak response regarding growth hormone stimulation tests in children
Thieme F, Vogel M, Gausche R, Beger C, Vasilakis IA, Kratzsch J, Körner A, Kiess W, Pfäffle RW
Horm Res Paediatr. 2022;95(5):452-460. doi: 10.1159/000526240. Epub 2022 Jul 29. -
2021: Age- and weight group-specific weight gain patterns in children and adolescents during the 15 years before and during the COVID-19 pandemic
Vogel M, Geserick M, Gausche R, Beger C, Poulain T, Meigen C, Körner A, Keller E, Kiess W, Pfäffle R
Int J Obes (Lond). 2022 Jan;46(1):144-152. doi: 10.1038/s41366-021-00968-2. Epub 2021 Sep 23. -
2021: COVID-19 pandemic and families utilization of well-child clinics and pediatric practices attendance in Germany
Vogel M, Beger C, Gausche R, Jurkutat A, Pfäffle R, Körner A, Meigen C, Poulain T, Kiess W
BMC Res Notes. 2021 Apr 16;14(1):140. doi: 10.1186/s13104-021-05562-3 -
2021: Dynamic alterations in linear growth and endocrine parameters in children with obesity and height reference values
Kempf E, Vogel M, Vogel T, Kratzsch J, Landgraf K, Kühnapfel A, Gausche R, Gräfe D, Sergeyev E, Pfäffle R, Kiess W, Stanik J, Körner A
Lancet EClinicalMedicine -
2021: [Primordial prevention in childhood to avoid chronic diseases]
Igel U, Gausche R, Lück M, Kiess W
Dtsch Med Wochenschr. 2021 Mar;146(6):374-380. doi: 10.1055/a-1241-1763. Epub 2021 Mar 18 -
2021: Kinder- und Jugendärzte leisten mit CrescNet-Monitoring einen wichtigen Beitrag für Public Health
Gausche R, Beger C, Hoepffner W, Pfäffle R
Ärzteblatt Sachsen 02 21 -
2020: Long-term mortality after childhood growth hormone treatment: the SAGhE cohort study
Sävendahl L, Cooke R, Tidblad A, Beckers D, Butler G, Cianfarani S, Clayton P, Coste J, Hokken-Koelega ACS, Kiess W, Kuehni CE, Albertsson-Wikland K, Deodati A, Ecosse E, Gausche R, Giacomozzi C, Konrad D, Landier F, Pfaeffle R, Sommer G, Thomas M, Tollerfield S, Zandwijken GRJ, Carel JC, Swerdlow AJ
Lancet Diabetes Endocrinol -
2020: A Comprehensive Cohort Analysis Comparing Growth and GH Therapy Response in IGF1R Mutation Carriers and SGA Children
Göpel E, Rockstroh D, Pfäffle H, Schlicke M, Pozza SB, Gannagé-Yared MH, Gucev Z, Mohn A, Harmel EM, Volkmann J, Weihrauch-Blüher S, Gausche R, Bogatsch H, Beger C, Klammt J, Pfäffle R
J Clin Endocrinol Metab. 2020 Apr 1;105(4):dgz165. doi: 10.1210/clinem/dgz165 -
2018: Acceleration of BMI in Early Childhood and Risk of Sustained Obesity
Geserick M, Vogel M, Gausche R, Lipek T, Spielau U, Keller E, Pfäffle R, Kiess W, Körner A
N Engl J Med. 2018 Oct 4;379(14):1303-1312. doi: 10.1056/NEJMoa1803527 -
2018: Growth prediction of small for gestational age infants within the first weeks after birth
Beger C, Merker A, Mumm R, Gausche R
Anthropol Anz. 2018 Feb 20. doi: 10.1127/anthranz/2018/0820 -
2017: Further stabilization and even decrease in the prevalence rates of overweight and obesity in German children and adolescents from 2005 to 2015: a cross-sectional and trend analysis
Kess A, Spielau U, Beger C, Gausche R, Vogel M, Lipek T, Körner A, Pfäffle R, Kiess W
Public Health Nutr. 2017 Dec;20(17):3075-3083. doi: 10.1017/S1368980017002257. Epub 2017 Sep 21 -
2017: Growth and Final Height Among Children With Phenylketonuria
Thiele AG, Gausche R, Lindenberg C, Beger C, Arelin M, Rohde C, Mütze U, Weigel JF, Mohnike K, Baerwald C, Scholz M, Kiess W, Pfäffle R, Beblo S
Pediatrics. 2017 Nov;140(5). pii: e20170015. doi: 10.1542/peds.2017-0015 -
2017: Supporting Pediatricians Decision-Making by using CrescNet as Infrastructure
Beger C, Gausche R, Müller R, Pfäffle R
62. Jahrstagung der GMDS. Meeting Abstract. 2017 Aug; doi: 10.3205/17gmds133 -
2017: Cystic-fibrosis Related-Diabetes (CFRD) Is Preceded by and Associated With Growth Failure and Deteriorating Lung Function
Terliesner N, Vogel M, Steighardt A, Gausche R, Henn C, Hentschel J, Kapellen T, Klamt S, Gebhardt J, Kiess W, Prenzel F
J Pediatr Endocrinol Metab. 2017 Aug 28;30(8):815-821. doi: 10.1515/jpem-2017-0005 -
2017: Cancer Risks in Patients Treated With Growth Hormone in Childhood: The SAGhE European Cohort Study
Swerdlow AJ, Cooke R, Beckers D, Borgström B, Butler G, Carel JC, Cianfarani S, Clayton P, Coste J, Deodati A, Ecosse E, Gausche R, Giacomozzi C, Hokken-Koelega ACS, Khan AJ, Kiess W, Kuehni CE, Mullis PE, Pfaffle R, Sävendahl L, Sommer G, Thomas M, Tidblad A, Tollerfield S, Van Eycken L, Zandwijken GRJ
J Clin Endocrinol Metab. 2017 May 1;102(5):1661-1672. doi: 10.1210/jc.2016-2046 -
2015: Psychosocial Well-Being of Adolescents Before and After a 1-Year Telephone-Based Adiposity Prevention Study for Families
Herget S, Markert J, Petroff D, Gausche R, Grimm A, Hilbert A, Kiess W, Blüher S
J Adolesc Health. 2015 Sep;57(3):351-4. doi: 10.1016/j.jadohealth.2015.05.014 -
2015: Description of the SAGhE Cohort: A Large European Study of Mortality and Cancer Incidence Risks after Childhood Treatment with Recombinant Growth Hormone
Swerdlow AJ, Cooke R, Albertsson-Wikland K, Borgström B, Butler G, Cianfarani S, Clayton P, Coste J, Deodati A, Ecosse E, Gausche R, Giacomozzi C, Kiess W, Hokken-Koelega AC, Kuehni CE, Landier F, Maes M, Mullis PE, Pfaffle R, Sävendahl L, Sommer G, Thomas M, Tollerfield S, Zandwijken GR, Carel JC
Horm Res Paediatr. 2015;84(3):172-83. doi: 10.1159/000435856. Epub 2015 Jul 23 -
2014: Telephone-based adiposity prevention for families with overweight children (T.A.F.F.-Study): one year outcome of a randomized, controlled trial
Markert J, Herget S, Petroff D, Gausche R, Grimm A, Kiess W, Blüher S
Int J Environ Res Public Health. 2014 Oct 3;11(10):10327-44. doi: 10.3390/ijerph111010327 -
2014: Clinical evidence-based cutoff limits for GH stimulation tests in children with a backup of results with reference to mass spectrometry
Wagner IV, Paetzold C, Gausche R, Vogel M, Koerner A, Thiery J, Arsene CG, Henrion A, Guettler B, Keller E, Kiess W, Pfaeffle R, Kratzsch J
Eur J Endocrinol. 2014 Sep;171(3):389-97. doi: 10.1530/EJE-14-0165 -
2014: Children and adolescents with type 1 diabetes in Germany are more overweight than healthy controls: results comparing DPV database and CrescNet database
Kapellen TM, Gausche R, Dost A, Wiegand S, Flechtner-Mors M, Keller E, Kiess W, Holl RW; DPV-Science-Initiative of the German Competence Network Diabetes and the German Competence Network Obesity (Consortium LARGE)
J Pediatr Endocrinol Metab. 2014 Mar;27(3-4):209-14. doi: 10.1515/jpem-2013-0381 -
2013: Prevention of childhood obesity: recruiting strategies via local paediatricians and study protocol for a telephone-based counselling programme
Markert J, Alff F, Zschaler S, Gausche R, Kiess W, Blüher S
Obes Res Clin Pract. 2013 Dec;7(6):e476-86. doi: 10.1016/j.orcp.2012.07.008 -
2012: Reasons for (non)participating in a telephone-based intervention program for families with overweight children
Alff F, Markert J, Zschaler S, Gausche R, Kiess W, Blüher S
PLoS One. 2012;7(4):e34580. doi: 10.1371/journal.pone.0034580. Epub 2012 Apr 3 -
2011: Früherkennung von Wachstumsstörungen - System CrescNet im Behandlungszentrum Leipzig
Hoepffner W, Pfäffle R, Gausche R, Meigen C, Keller E
Deutsch Ärztebl 2011;108:123-128 -
2011: Age-specific stabilization in obesity prevalence in German children - a cross sectional study from 1999 to 2008
Blüher S, Meigen C, Gausche R, Keller E, Pfäffle R, Sabin M, Werther G, Odeh R, Kiess W
Int J Pediatr Obes 2011; 6: 99-106 -
2009: Gezielte primäre Adipositasprävention bei Kindern. Prevention for obesity in childhood
Keller A, Klossek A, Gausche R, Hoepffner W, Kiess W, Keller E
Dtsch Med Wochenschr 2009; 134:13-18 -
2008: Secular trends in body mass index in German children and adolescents: a cross-sectional data analysis via CrescNet between 1999 and 2006
Meigen C, Keller A, Gausche R, Kromeyer-Hauschild K, Blüher S, Kiess W, Keller E
Metab Clin Exp 2008; 57: 934-939 -
2007: Aufbau, klinische Relevanz und Projekte des Wachstumsnetzwerks CrescNet
Hoepffner W, Gausche R, Meigen C, Keller A, Keller E
Ärzteblatt Sachsen 9/2007, S. 461-463 -
2005: Grundlagen eines Programms zur Adipositasprävention bei Kindern und Jugendlichen
Gausche R, Hoepffner W, Keller E
psychomed 2005; 17/2: 90-93 -
2004: Fettsucht bei Kindern
Gausche R, Keller E
Kinderreport Deutschland 2004. München, kopaed, 2004, ISBN 3-938028-24-6 -
2004: System CrescNet: Erkennung von Störungen des Wachstums und der Gewichtsentwicklung sowie Gewinnung aktueller Entwicklungsdaten
Keller E, Gausche R, Hoepffner W, Burmeister J, Meigen C, Kiess W, Keller A
Pädiat Prax 2004; 65: 569-579 -
2003: Alterations in Height, Weight and Body Mass Index of Newborns, Children and Young Adults in Eastern Germany after German Reunification
Hesse V, Voigt M, Sälzer A, Steinberg S, Friese K, Keller E, Gausche R, Eisele R
J Pediatr 2003; 142: 259-262 -
2003: Früherkennung von Wachstumsstörungen: CrescNet - ein Beitrag zur Qualitätsicherung in der Kinder- und Jugendmedizin
Keller A, Gausche R, Keller E
Glandula 2003; 18: 24-27 -
2002: Adipositas bei Kindern und Jugendlichen in Deutschland
Wabitsch M, Kunze D, Keller E, Kiess W, Kromeyer-Hauschild K
Fortschr Med 2002; 20: 99-106 -
2002: Auxological computer based network for early detection of disorders of growth and weight attainment
Keller E, Gausche R, Meigen C, Keller A, Burmeister J, Kiess W
J Pediatr Endocrinol Metab 2002; 15: 149-156 -
2001: Computer-guided, population-based screening system for growth disorders (CrescNet) and on-line generation of normative data for growth and development
Kiess W, Gausche R, Keller A, Burmeister J, Willgerodt H, Keller E
Horm Res 2001; 56, Suppl 1: 59-66 -
2000: Modellprogramm zur Früherkennung und optimalen Behandlung von Störungen des Wachstums und der körperlichen Entwicklung mit Hilfe eines medizinischen Kompetenznetzwerkes
Keller E, Burmeister J, Gausche R, Keller A, Hermanussen M, Kiess W
Z ärztl Fortbild Qual sich 2000; 94: 695-698 -
1996: Wachstumsstörungen rechtzeitig erkennen - eine Aufgabe für die praktische Pädiatrie
Keller E
Hautnah pädiatrie 1996; 8: 16-22 -
1996: Instrumentarium zur Diagnostik von wachstumsgestörten Kindern und Jugendlichen
Keller E
Sozialpäd KiPra 1996; 18: 648-651 -
1994: Screening auf Vorliegen einer Wachstumsstörung mit Hilfe des Präzisionsmeßinstrumentes und Systems Dr. Keller
Keller E
Anthrop Anz 1994; 52: 321-332